Flotation is a fascinating field for the combination of data analyses and fundamental chemical engineering. On the one hand the basic measurements are readily available to determine whether the process is running in a broadly sufficient operating window, while on the other there are many indirect measurements of countless disturbances and influencing upstream conditions.
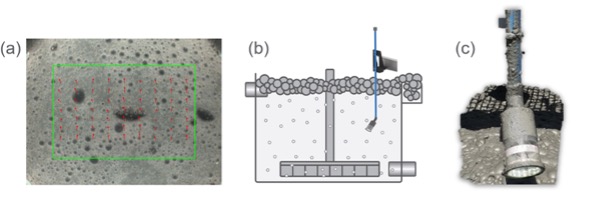
In no area is this more apparent than the actual pulp (seen below on the left) within which the particle attachment happens. Flow rates, densities, pulp levels, concentrate pump flows, and even top of froth measurements are readily available, yet in-pulp measurements are few and far between. In this blog post we will briefly investigate the pulp bubble changes observed with an in-pulp sensor (below on the right) during anomalous and forced events.
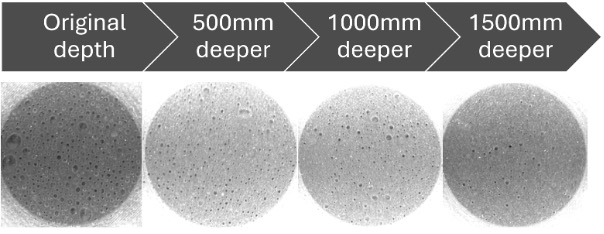
The first challenge is to ensure the sensor is placed at the correct depth to observe the bubbles travelling uniformly through the pulp, but not yet in the top of froth layer. Below we can clearly see the difference in bubble-bubble interaction at various pulp sensor depths – with the original depth starting to show a more froth structure and the 1500mm deeper image showing a good balance between pulp and bubble areas.
These sensors need to operate in a harsh environment at high frame rates to track and segment the bubbles. Once the sensors were optimized frother was removed from the feed sump and the resultant pulp bubbles observed. A reduction in frother should lead to bubbles coalescing as they travel upwards and the pulp sensor should observe fewer, and much larger, bubbles:
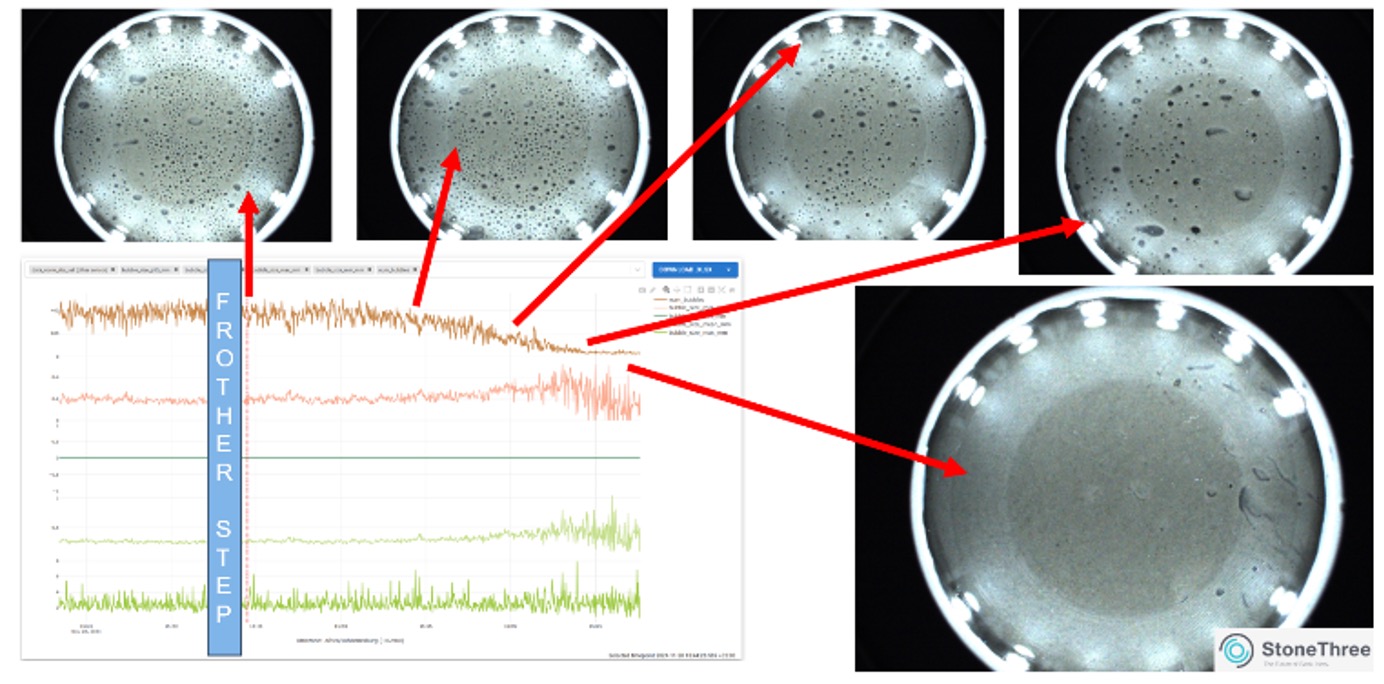
The above trends clearly show this expected behaviour, and we can conclude the sensor is able to observe frother depletion events. In continuous operation these events may happen due to faults on the frother flow line, material in the feed that absorbs the frother, or airflow changes (to name a few).
In cooperation with site, we were able to investigate over two months of continuous data to search for similar events and then report on the health of each monitored cell, example event shown below:

While this is a significant data exercise – millions of data records and images need to be analysed and filtered – the results allow for greater visibility into pulp bubble performance and the rejection of disturbance events.